Confluency: definition
Confluency is the percentage of the growth medium area covered by adherent cells (e.g. 50% confluency indicates that 50 out of 100 parts of the growth surface are occupied by cells – if the surface is 2 cm2, then 1 cm2 will be occupied by cells).
This indicator is used to evaluate cell growth and expansion and when to divide cells, before they reach full confluency (usually at 80% confluency, but variable between different cell types).
Furthermore, on the basis of the density, and therefore of the confluency of the cells, the cellular response to a specific environmental or pharmacological stimulus can also vary, as mentioned.
Accurate and repeatable measurements of confluency are therefore essential in standardizing cell culture operations.
Method for estimating confluency 1) visual estimation
This method for estimating confluency is naturally the coarsest and the most prone to errors and arbitrary decisions.
However, it can be convenient to use it when cell cultures are only to be expanded, in routine divisions.
This method also requires that you have gotten to grips with the cell culture you are using, that you have done a growth curve under control conditions, and know how long it takes for cells to divide after they have been plated at a certain density.
It is the fastest method, but it requires some experience.
Method for estimating confluency 2) Image J
When I am dealing with a new cell line or when it is necessary to have a more precise estimate of the confluence of the cells, I use this simple and quick method which involves the use of Image J.
By means of this method you can even follow cell proliferation over time. In this case it is necessary to always select the same field under the microscope. To achieve this, you have to mark the support in the analyzed region with a permanent marker or by creating a mask with a sheet of opaque adhesive paper that leaves only the region of interest visible.
It only takes a little time to learn and set the best conditions the first time, then it’s really simple and fast (5 minutes and it’s done!)
Image J is a free image analysis software downloadable here
TAKE A PICTURE OF THE CELLS
1. Take a picture of the cells by observing them with the phase contrast microscope.
My microscope does not have a camera included, so I use my mobile phone, which I keep at a distance of a couple of cm from the eyepiece, focusing the image that forms in the eyepiece, with the maximum zoom of the phone.
There are cell phone holders online that facilitate the operation. I bought this one.
it is advisable to evaluate the confluence at least two different points of the growth support because the growth can be uneven
ANALYSIS OF THE CONFLUENCE OF CELLS
2. Open image J and select the photo you just acquired (File … open)

this is the image as it appears immediately after acquisition
3. Transform the image from RGB color to 8 bit (Image–> Type–>8bit), a flag will appear near the 8 bit

4. Now you have to subtract the background in order to make the cells more evident. After this the cells will then be selectable by applying a threshold.
To do this: select Process –> Suctract Background
this menu box will appear

the suctract bg menu
in the box menu select light backgruond and preview and select a value for the rolling ball radius in order to obtain a sufficiently contrasted image (in this case I used 90, you have to try for your images, usually it is between 60 and 150)
this is the image I get this way
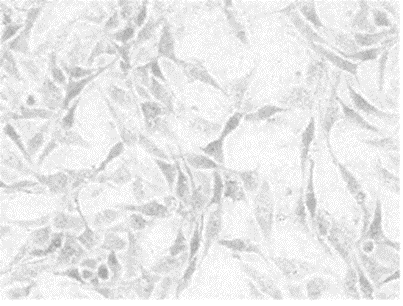
background subctracted
5. You need now to apply a filter to reduce noise and sharpen the cell selection
Process–>Filters–>Median

median filter box
A radius of 5 is usually enought to “clean” the image selection.
6. Now, you can create a threshold to select only the cells,
Image–> adjust–>threshold

thresholded image. In red: cells

the threshold menu
you will end up with a binary (two colour, black and white) image

binary thresholded image (in white are highlighted the cells)
7. It’s almost done! in the Analyse–> set measurement menu select the value you want to measure in your image. You need area frection that will give you the valule in percentage of the white area (cells) divided by the total area of the image multiplied x 100. That is exactly the measure of the confluency.

slect measurements —>area fraction
8. With the square selection toll select the whole area of the image

square selection tool
9. Put the region of interest in the roi manager (analyze —>tool–> Roi manager), click on Add


9. click measure in the ROI manager dialog box and you will end up with the results

the confluency value or area fraction
In this case my confluency was almost 50%.
Other methods for assessing confluence
Non-invasive and non-destructive measurements of confluence in cultured adherent cell lines